Based on what I learned in the MIT program, I made this diagram that visually shows us the steps to carry out an ML project. I hope it will help everyone. We can use it as another tool to apply everything we have learned. I would also like to know if concepts are missing in this Process Map, which would be a point of improvement in the diagram. I will gladly send you an updated version.
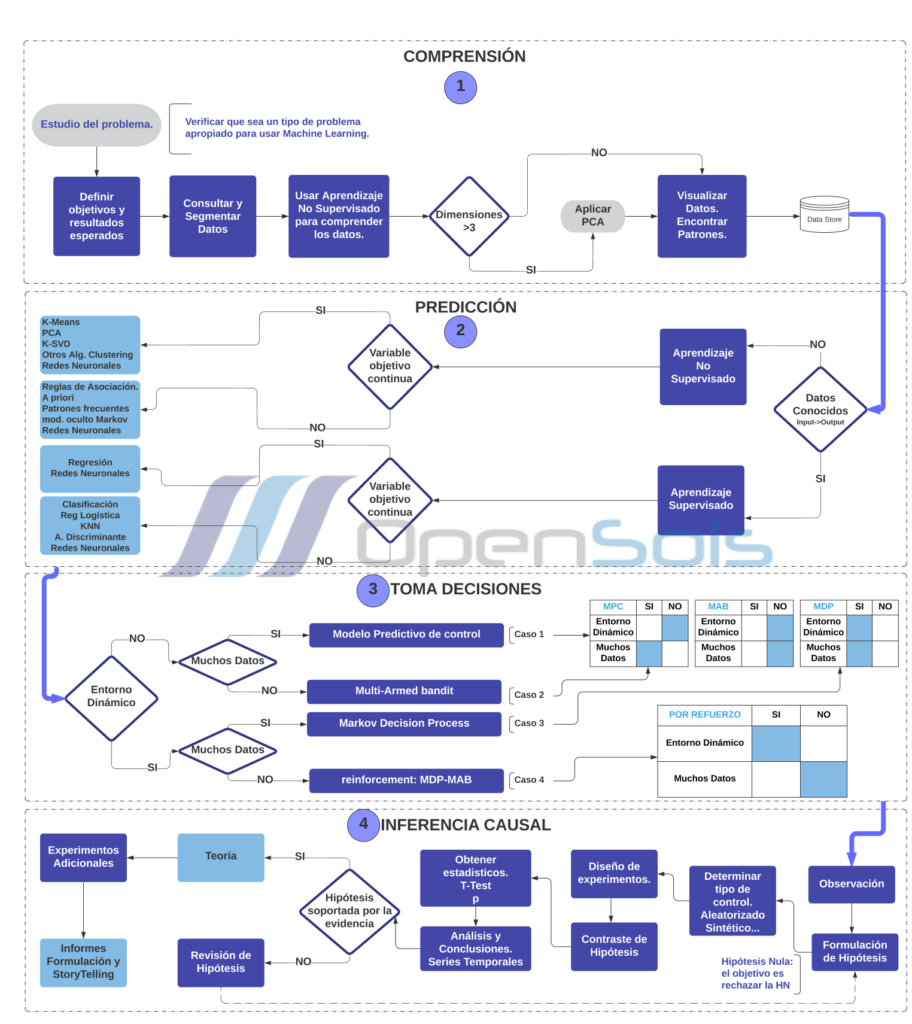
The previous diagram contains the process, from my point of view, for developing a Machine Learning project within the framework of the four phases defined in this study program.
Via the use of Machine Learning we make decisions based on the predictions of behavior patterns of any real-life event. In my opinion, the first phase of ML, understanding the data, is vital in the study that interests us. I think that we can also explore the problem from the point of view of the processes of the entity where it occurs, be it a company, domain, or other studies.
By creating a detailed map of each of the elements and connections of the problem of interest and submitting the data to algorithms to find common patterns, dependent variables, independent variables, and predictive models, we are applying the second phase of ML: prediction.
After defining the model to predict our target variable, we will obtain the data derived from the forecasts. We will use these data for the third phase of ML, corresponding to decision-making. For this, we will consider the type of scenario according to the dynamism of the environment and the amount of data we have. Once we implement it in our business or study domain, we will collect the resulting data for further analysis.
Finally, in the fourth phase of ML, causal inference, we evaluated whether these results were satisfactory and what causes affected the performance of our model the most. As we improve the prediction model, we improve the entire process chain of the machine learning project we are implementing. This last phase allows us to understand what caused the success or failure of the policies implemented based on the data, algorithms, models, and methods learned in this program.
The concept that strikes me the most is that we will never have the perfect model or the certainty that the decision-making will be 100% correct. But the more tools we know and the better “artists” we are with the data, the closer we will be to achieving projects of Machine Learning.
For this short dissertation, I put on the hat of the CEO & Founder at OpenSols (https://opensols.com/). I consider that ML gives us the peace of mind that our future decisions will base on scientific facts with a quantitative and results-oriented approach. It allows us at OpenSols to provide powerful management tools to our directors and middle managers, to combine their experience and intuition with data analytics. On the other hand, we have strengthened our main offer of services based on Big Data, adding the construction of machine learning models. With this, we provide our clients with added value that allows them to carve their data like a rough diamond that becomes valuable information, assertive decision-making, and a sustainable competitive advantage.
Osorio, Carlos.“Process map to implement Machine Learning projects” Translated by OpenSols,(07 Febrary 2023). https://opensols.com/the-future-of-business-intelligence-bi-and-business-analytics-ba/
